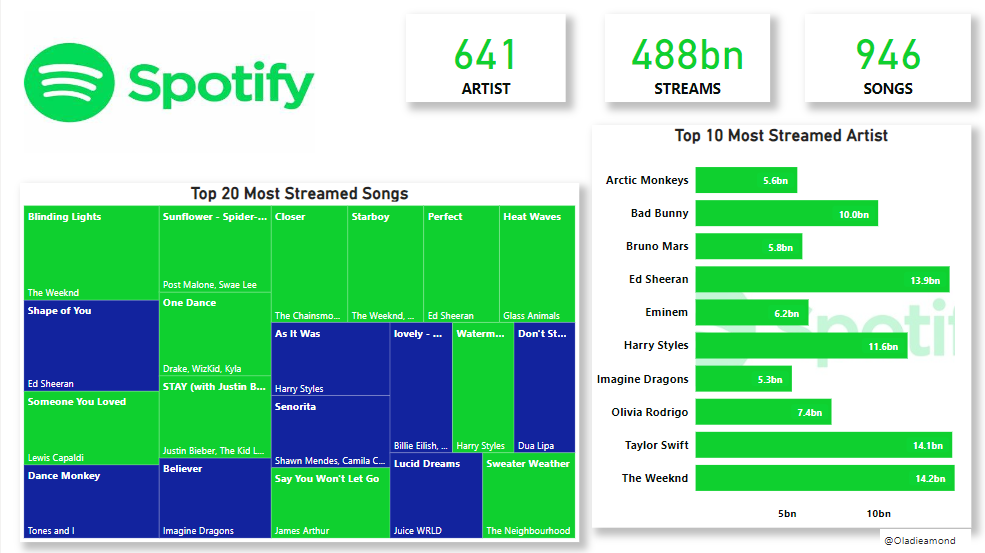
This project was carried out to analyze streaming on Spotify by identifying trends, patterns, and factors
that impact streaming. The dataset was cleaned using Microsoft Excel and Visualization was done using Microsoft PowerBi. It
was an interesting project to do because it was an eye-opener on some levels. The insight drawn from the
analysis is that while the Mode of music is not the only contributing factor to how well a song is
streamed, it has a high impact on it....

Aimed at better understanding of the pricing and subscription of Udemy courses from four
different subjects, which helped identify the subject in which more courses should be created and create
targeted strategies to increase the company revenue. The dataset was cleaned and analyzed with the help of Google Sheets and Visualization was done with
Tableau. The insight drawn from the data is that Web Development has the highest number of subscribers...
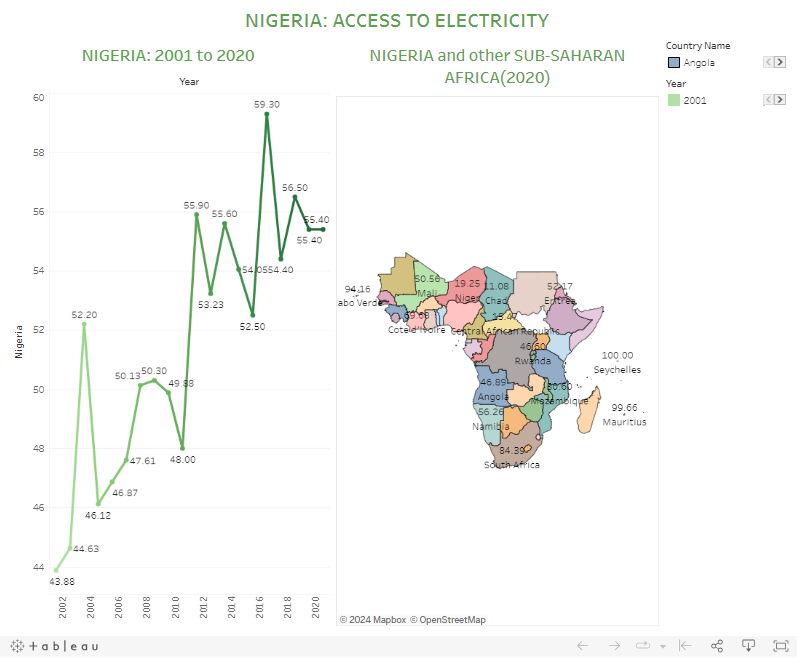
This Dashboard provides insight derived from the analysis of the data, as provided by The World Bank.
Stable electricity and access to it being a major challenge to the Nigeria economy and its socio-economic development,
this dashboard explores the data and one of the key insight drawn is that the percentage of the Nigeria
population that have access to electricity always increase post-election period.......